Figure 14.1 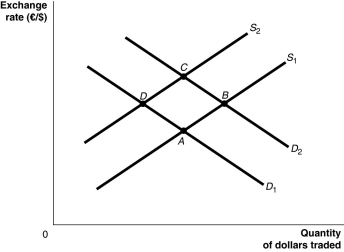 Alt text for Figure 14.1: In figure 14.1, a graph illustrates the quantity of dollars traded against the exchange rate.
Long description for Figure 14.1: The x-axis is labelled, quantity of dollars traded, and the y-axis is labelled, exchange rate, euros against dollars.2 supply curves; S1 and S2, and two demand curves; D1 and D2 are plotted.Supply curve S1 is a straight line which slopes up from the bottom left corner to the top left corner, and passes through points A and B.Supply curve S2 is a straight line with the same slope as S1, but plotted above.S2 passes through points D and C.Demand curve D1 is a straight line, which slopes down from the top left corner to the bottom right corner.Curve D1 intersects curve S1 at point A, and curve S2 at point D.Demand curve D2 is a straight line with the same slope as D1, but plotted above.Curve D2 intersects curve S1 at point B, and curve S2 at point C.
-Refer to Figure 14.1.Currency speculators believe that the value of the euro will increase relative to the dollar.Assuming all else remains constant, how would this be represented?
Definitions:
Indirectly
In a manner that is not straightforward or direct; happening through secondary or alternative means or effects.
Duties
Responsibilities or obligations that an individual, company, or government has under the law or contract.
Agency Agreement
A contract where one party (the agent) agrees to act on behalf of another (the principal) in business transactions.
Operation Of Law
An operation of law is a legal change that occurs automatically due to existing legal rules, rather than actions taken by the parties themselves.
Q5: Thailand's experience with pegging the baht to
Q14: Evidence shows that for many people, delaying
Q35: Which of the following is a reason
Q83: How does an increase in a country's
Q120: Under pressure from Japan, the United States
Q129: If Québecers decrease their purchases of French
Q154: Suppose that Bank of Canada policy leads
Q164: If inflation in Mexico is lower than
Q227: If actual inflation is less than expected
Q240: Refer to Figure 14.1.Suppose that Canadian government