Exhibit 7.1
The following questions are based on the problem below.
A company wants to advertise on TV and radio. The company wants to produce about 6 TV ads and 12 radio ads. Each TV ad costs $20,000 and is viewed by 10 million people. Radio ads cost $10,000 and are heard by 7 million people. The company wants to reach about 140 million people, and spend about $200,000 for all the ads. The problem has been set up in the following Excel spreadsheet. 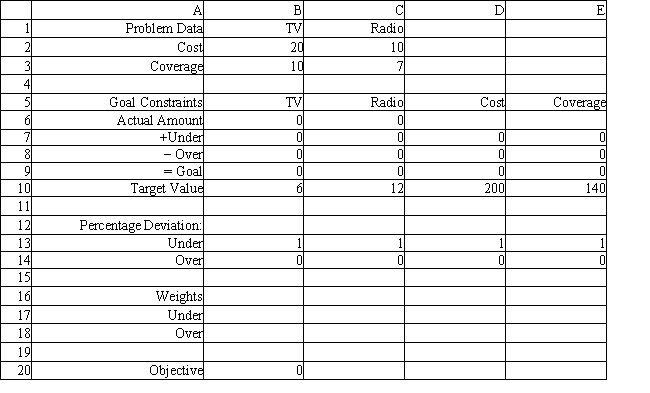
-Refer to Exhibit 7.1. Which cell(s) is(are) the objective cell(s) in this model?
Definitions:
Services Sector
A segment of the economy composed of businesses and individuals that provide intangible goods or services to consumers, such as healthcare, education, finance, and hospitality.
Enterprise Resource Planning (ERP)
An integrated management of main business processes, often in real time and mediated by software and technology, aimed at improving efficiency and data accuracy.
Global Database
A comprehensive collection of data or information accessible from multiple countries, often used for research, analysis, or business intelligence.
Surplus Materials
Excess resources or goods that are available after satisfying the planned demand or requirement.
Q5: The constraint X<sub>13</sub> + X<sub>23</sub> -X<sub>34</sub>
Q9: A manager has only 200 tons of
Q14: The method of least squares finds parameter
Q25: Refer to Exhibit 11.3. What is
Q37: Simulation is used to<br>A)find possible worst case
Q54: Sal, from Exhibit 12.5, has produced the
Q55: Which type of queuing system are you
Q60: Data Envelopment Analysis (DEA) is an LP-based
Q84: A financial planner wants to design a
Q110: The general form of an extrapolation model