Exhibit 12.3
The following questions use the information below.
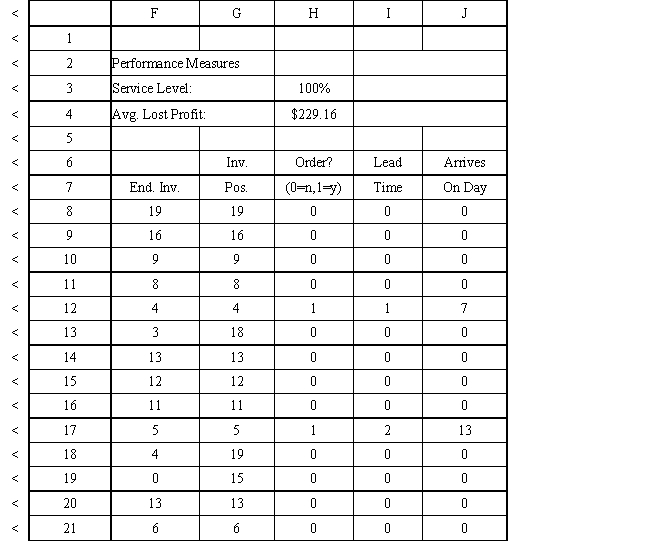
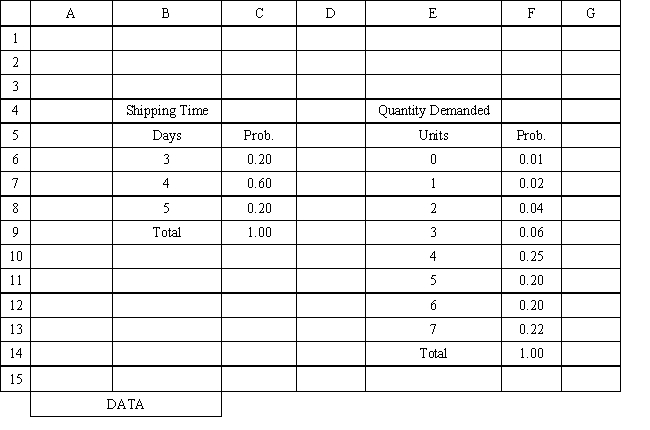
An auto parts store wants to simulate its inventory system for engine oil. The company has collected data on the shipping time for oil and the daily demand for cases of oil. A case of oil generates a $10 profit. Customers can buy oil at any auto parts store so there are no backorders (the company loses the sale and profit) . The company orders 30 cases whenever the inventory position falls below the reorder point of 15 cases. Orders are placed at the beginning of the day and delivered at the beginning of the day so the oil is available on the arrival day. An average service level of 99% is desired. The following spreadsheets have been developed for this problem. The company has simulated 2 weeks of operation for their inventory system. The current level of on-hand inventory is 25 units and no orders are pending. 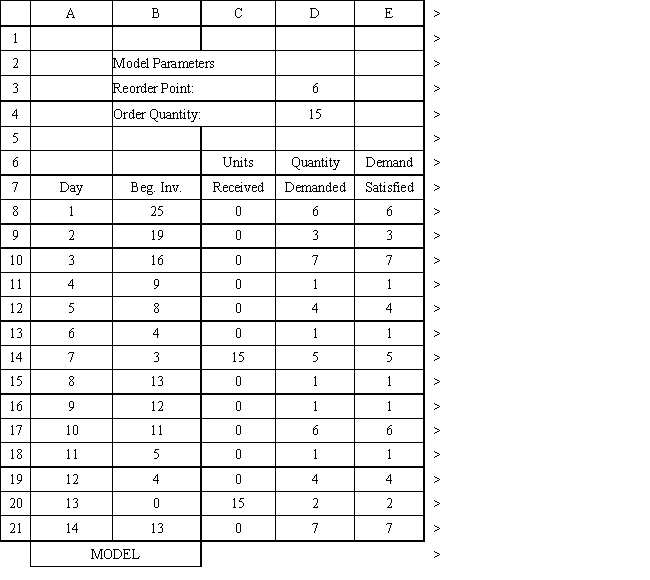
-Using the information in Exhibit 12.3, what formula should go in cell C9 and copied to C10:C21 of the MODEL sheet to compute units received?
Definitions:
Cost Curves
Cost curves are graphical representations of the costs associated with producing varying quantities of goods, showing how costs change with changes in output.
Pure Competition
A market structure characterized by a large number of small firms, identical products, and free entry and exit, leading to price determination by market demand and supply.
Market Entry
The process by which a new competitor enters an existing market, often involving overcoming barriers to entry.
Q6: The Risk Solver Platform (RSP) is a
Q7: Refer to Exhibit 10.1. What percentage of
Q13: Refer to Exhibit 15.1. What array formula
Q19: Large C corporations must use the accrual
Q21: Probabilistic decision rules can be used if
Q33: To find steady-state values for the
Q34: A company will be able to
Q41: A company wants to manage its distribution
Q53: The terms b<sub>0</sub> and b<sub>1</sub> are referred
Q81: What is the formula for the exponential