Table 6-4
The following table contains the demand schedule and supply schedule for a market for a particular good. Suppose sellers of the good successfully lobby Congress to impose a price floor $3 above the equilibrium price in this market. 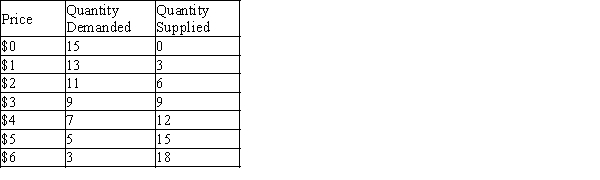
-Refer to Table 6-4. Following the imposition of a price floor $3 above the equilibrium price, irate buyers convince Congress to repeal the price floor and to impose a price ceiling $1 below the former price floor. The resulting shortage is
Definitions:
Long-Run Cost Curve
A graphical representation showing the lowest cost at which any given level of output can be produced in the long run, where all inputs are variable.
Industry Supply Curve
A graph that shows the quantity of goods that producers are willing and able to sell at different price levels in a specific industry.
Marginal Costs
Marginal costs are the additional costs incurred to produce one more unit of a product or service.
Total Cost Function
Describes the complete cost of producing a given level of output, summing up all variable and fixed costs associated with production.
Q112: On a graph,consumer surplus is represented by
Q158: Refer to Figure 5-6.Using the midpoint method,the
Q166: In which of the following situations will
Q169: Markets will always allocate resources efficiently.
Q182: Consumer surplus is the amount a buyer
Q316: Refer to Figure 6-4.Suppose a price ceiling
Q323: Moving downward and to the right along
Q344: Refer to Table 7-6.Who is a marginal
Q356: Refer to Table 7-9.Both the demand curve
Q387: A large majority of economists favor eliminating