Figure 9.16 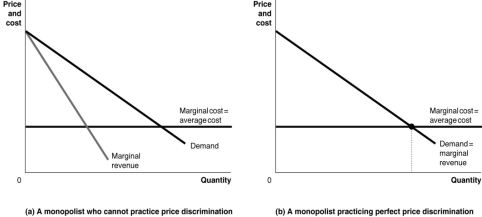
-Refer to Figure 9.16.Graph (a)represents a monopolist who cannot price discriminate and graph (b)represents a monopolist practicing perfect price discrimination.On each graph, identify the monopoly price, the monopoly output, the efficient output, and the areas representing profit, consumer surplus, and deadweight loss.
__________________________________________________________________________________________________________________________________________________________________________________________
Definitions:
Demographics
The statistical characteristics of human populations, such as age, gender, income, and education, used especially to identify consumer markets.
Tapestry Analysis
A method of consumer segmentation that uses demographic and geographic data to identify, understand, and target specific consumer groups based on their behaviors, preferences, and needs.
Upper-Income
Refers to individuals or households that earn more than the average income level, often associated with higher purchasing power and consumption patterns.
Suburban
Pertaining to residential areas on the outskirts of a city, typically characterized by lower population density than urban areas.
Q52: In the short run, a profit-maximising firm
Q57: Refer to Figure 8.14.Which panel best represents
Q103: Joss is a marketing consultant.Iris and Daphne
Q119: If a monopolist engages in first-degree price
Q120: Which of the following is not a
Q144: Marginal revenue product for a perfectly competitive
Q158: Brand management refers to<br>A)picking a brand name
Q174: Which of the following products allows the
Q209: For a perfectly competitive firm, which of
Q209: Assume that a monopolist practices perfect price