Multiple Choice
Figure 8-6
The vertical distance between points A and B represents a tax in the market. 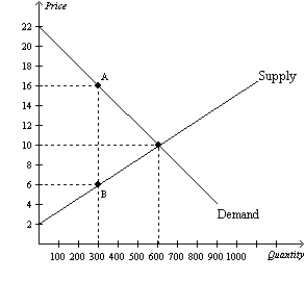
-Refer to Figure 8-6.When the tax is imposed in this market,the price sellers effectively receive is
Definitions:
Source Inspection
Controlling or monitoring at the point of production or purchase— at the source.
Related Questions
Q10: Refer to Figure 8-11. Suppose Q1 =
Q37: Refer to Figure 7-15. When the price
Q48: Refer to Figure 7-21. Which area represents
Q72: If the labor supply curve is very
Q202: If the size of a tax increases,
Q298: Refer to Figure 8-21. Suppose the government
Q309: Suppose a tax of $1 per unit
Q421: Refer to Figure 7-13. If the equilibrium
Q433: Refer to Figure 9-4. With trade, Nicaragua<br>A)
Q515: Which of the following equations is valid?<br>A)