Figure 3.8 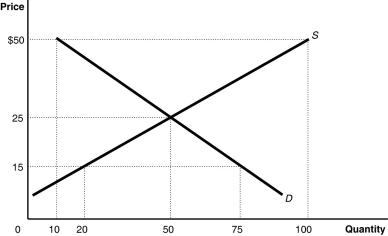 Alt text for Figure 3.8: In figure 3.8, a graph plotting intersecting supply and demand curves represents the market for canvas tote bags.
Long description for Figure 3.8: The x-axis is labelled, Quantity, with the values 0, 10, 20, 50, 75, and 100 marked.The y-axis is labelled, Price, with the values 0, 15, 25, and 50 dollars marked.Curve D is a straight line which slopes down from the top left corner to the bottom right corner.Curve S is a straight line which begins in the bottom left corner and slopes up to the top right corner.The equilibrium of the 2 curves is (50,25) .The point plotted on curve S to the left of equilibrium is (20,15) .The point plotted on curve D to the right of point of equilibrium is (75,15) .The point plotted to the right of equilibrium on curve S is (100,50) .The point plotted to the right of the equilibrium on curve D is (10,50) .
-Refer to Figure 3.8.The figure above represents the market for canvas tote bags.Compare the conditions in the market when the price is $50 and when the price is $35.Which of the following describes how the market differs at these prices?
Definitions:
Faith Stages
A conceptual framework outlining the evolution of an individual's faith or belief system across different phases of life.
Complicated Grief
A prolonged and intense form of grief that significantly impairs one's ability to function in daily life.
Depression
A common and serious mood disorder characterized by persistent feelings of sadness, hopelessness, and a lack of interest or pleasure in activities.
Exaggerated Response
An overly dramatic or intensified reaction to a situation or stimulus, often beyond what is considered normal.
Q85: An example of a transfer payment is<br>A)a
Q87: Refer to Figure 2.21.One segment of the
Q125: All else equal,an increase in the number
Q158: The opportunity cost of taking an online
Q166: Refer to Figure 2.13.What is the opportunity
Q169: An article in the Wall Street Journal
Q223: Fill in the missing values in the
Q224: Refer to Figure 3.11.At a price of
Q238: Refer to Table 2.12.What is Finland's opportunity
Q253: The production possibilities frontier model assumes which