Figure 7.3 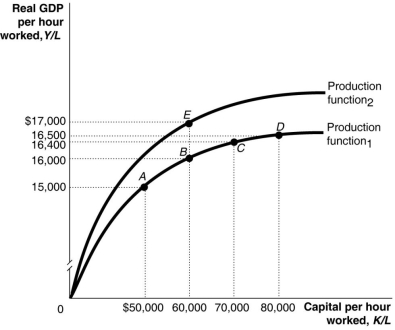 Alt text for Figure 7.3: In figure 7.3, a graph, comparing capital per hour worked and real GDP per hour worked.
Long description for Figure 7.3: The x-axis is labelled, capital per hour worked, K/L.The y-axis is labelled, real GDP per hour worked, Y/L.2 concave curves originating from 0 at the vertex are shown.5 points A ($50000, $15000) , B ($60000, $16000) , C ($70000, $16400) , D ($80000, $16500) , and E ($60000, $17000) are plotted.The curve labelled Production function 1, passes through points A, B, C, and D.The curve labelled Production function 2, passes through point E.These 5 points are connected to their respective coordinates on the x and y-axis with dotted lines.
-Refer to Figure 7.3.Technological change is shown in the figure above by the movement from
Definitions:
Elasticity
A measure in economics that denotes the responsiveness of the quantity demanded or supplied of a good or service to a change in its price.
Product Uses
The various applications or purposes for which a product is intended or can be utilized by consumers.
Unit Elasticity
A situation in economics where a change in the price of a good or service results in a proportionally equal change in the quantity demanded or supplied.
Price Elasticity of Demand
A measure of the sensitivity of quantity demanded of a good to a change in its price.
Q21: Consumption spending will _ when disposable income
Q66: Draw a graph of "catch-up" that shows
Q93: The formula for calculating the CPI is<br>A)(expenditures
Q104: Robert Lucas,a Nobel laureate in economics,argues that
Q106: There is a federal budget deficit when<br>A)the
Q155: Suppose that real GDP for 2010 was
Q223: When the economy reaches a trough in
Q234: The multiplier is calculated as the change
Q238: During the expansion phase of the business
Q259: The difference between GDP and net taxes