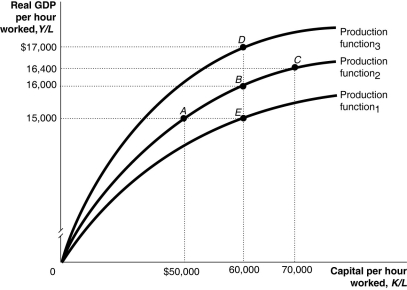
Figure 7.4  Alt text for Figure 7.4: In figure 7.4, a graph representing per-worker production functions.
Long description for Figure 7.4: The x-axis is labelled, capital per hour worked, K/L.The y-axis is labelled, real GDP per hour worked, Y/L.3 concave curves originating from 0 at the vertex are shown.5 points A ($50000, $15000) , B ($60000, $16000) , C ($70000, $16400) , D ($60000, $17000) , and E ($60000, $15000) are plotted.The curve labelled, Production function 1, passes through point E.The curve labelled, Production function 2, passes through points A, B, and C.The curve labelled, Production function 3, passes through point D.These 5 points are connected to their respective coordinates on the x-axis and y-axis with dotted lines.
-Refer to Figure 7.4.Within a country, the impact of wars and revolutions and their subsequent destruction of capital is reflected in the per-worker production function in the figure above by a movement from
Definitions:
Direct Non-Controlling Interest
A proportional interest in a subsidiary not held by the parent company, representing a share in the equity and profits of the subsidiary.
Retained Earnings
The portion of net income not distributed as dividends but retained by the company to be reinvested in its core business or to pay debt.
Limited
Describes a form of company structure that legally protects its shareholders' liability to the amount of capital they invested.
Consolidation Adjustment Entries
are journal entries made in the preparation of consolidated financial statements to eliminate transactions between entities within the same group, ensuring accurate representation of financials as if the group was a single entity.
Q42: In a closed economy,which of the following
Q48: Refer to Figure 7.4.Which of the following
Q63: Knowledge capital is<br>A)rival.<br>B)nonrival.<br>C)nonexcludable.<br>D)both B and C
Q72: When firms benefit from the results of
Q75: At macroeconomic equilibrium<br>A)total investment equals total inventories.<br>B)total
Q207: _ save a _ of their income.This
Q232: Refer to Table 5.20.The table above lists
Q236: Consumer spending _ and investment spending _.<br>A)is
Q237: Why would knowledge capital exhibit increasing returns
Q248: For all points above the 45-degree line,planned