Figure 8.4 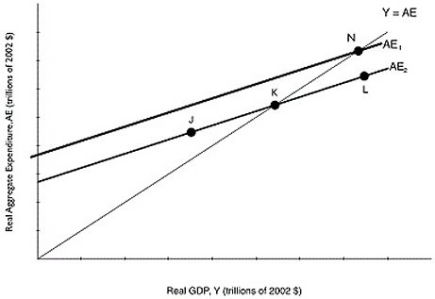 Alt text for Figure 8.4: In figure 8.4, a graph comparing real GDP and real aggregate expenditure.
Long description for Figure 8.4: The x-axis is labelled, real GDP, Y (trillions of 2002 dollars) .The y-axis is labelled, real aggregate expenditure, AE (trillions of 2002 dollars) .Line AE1, begins a little less than half way along the x-axis and slopes up to the end of the x-axis.Line AE2, begins half way along the x-axis and slopes up to the top right corner.Line AE2 is to the right of line AE1 and is on a similar path as line AE1.Line Y = AE, originates at the vertex and slopes up to the top right corner.Line Y = AE meets line AE2 at point K, half way along both lines.Line Y = AE meets line AE1 at point N, plotted close to the right end of line AE1.Point J is plotted a little less than half way along line AE2, to the left of point K.Point L is marked close to the right end of line AE2, to the right of point K.
-Refer to Figure 8.4.Suppose that the level of GDP associated with point K is potential GDP.If the Canadian economy is currently at point N,
Definitions:
Q1: Stagflation occurs when aggregate supply and aggregate
Q24: Foreign direct investment in Canada increased 3.8
Q61: Consumption spending is $22 million,planned investment spending
Q87: How do government policies that enforce property
Q116: If firms sell what they expected to
Q120: Suppose you withdraw $1,000 in cash from
Q151: You earn $500 a month,currently have $200
Q231: Refer to Figure 9.8.Given the economy is
Q253: If planned aggregate expenditure is below potential
Q256: Refer to Figure 7.3.A large group of