Figure 8.5 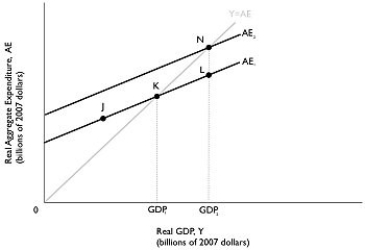 Alt text for Figure 8.5: In figure 8.5, a graph comparing real GDP and real aggregate expenditure.
Long description for Figure 8.5: The x-axis is labelled, real GDP, Y (billions of 2007 dollars) with values GDP1 and GDP2 marked.The y-axis is labelled, real aggregate expenditure, AE (billions of 2007 dollars) .Line AE1 begins a little less than half way along the x-axis and slopes up to the end of the x-axis.Line AE2 begins at a point half way along the x-axis and slopes up to the top right corner.Line AE2 is to the left of line AE1 and is on a similar path as line AE1.Line Y = AE, originates at the vertex and slopes up to the top right corner.Line Y = AE meets line AE1 at point K, half way along both lines.Line Y = AE meets the line AE2 at point N, plotted close to the right end of line AE2.Point J is marked a little less than half way along line AE1, to the left of point K.Point L is plotted close to the right end of line AE1, to the right of point K.Points K, L, and N are connected to their respective coordinates, GDP1 and GDP2, on the x-axis with dotted lines.
-Refer to Figure 8.5.Suppose that investment spending increases by $10 million, shifting up the aggregate expenditure line and GDP increases from GDP1 to GDP2.If the MPC is 0.9, then what is the change in GDP?
Definitions:
Variable Costing
An accounting approach where only variable production costs are assigned to inventory, distinguishing it from absorption costing by treating fixed overhead as a period cost.
Income Statement
A financial statement that shows a company's revenues and expenses over a specific period, resulting in a net income or loss.
Variable Costing
An accounting method that only assigns variable costs to inventory, excluding fixed manufacturing overhead costs.
Unit Product Cost
The total cost (both direct and indirect) associated with producing a single unit of product.
Q52: Refer to Figure 7.3.Many workers leaving a
Q69: The level of aggregate supply in the
Q109: The short-run aggregate supply curve is vertical.
Q131: The long-run aggregate supply curve shows the
Q143: Suppose the economy is at full employment
Q200: A car dealer sells you a car
Q219: Firms in a small economy anticipated that
Q243: Suppose you deposit $2,000 into Royal Bank
Q246: In September of 2007,the Bank of Canada
Q268: The aggregate expenditure model focuses on the