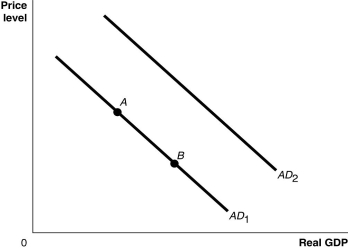
Figure 9.1  Alt text for Figure 9.1: In figure 9.1, a graph comparing real GDP and price level.
Long description for Figure 9.1: The x-axis is labelled, real GDP, and the y-axis is labelled, price level, with 0 at the vertex.Line AD1 begins in the top left corner and slopes down to the bottom center.Line AD2 follows the same slope as line AD1 but is plotted to the right.Points A and B are plotted along line AD1.Point A is a little less than half way along the left side of the line, and point B is little more than half way on the right side of the line.
-Refer to Figure 9.1.Ceteris paribus, an increase in the value of the domestic currency relative to foreign currencies would be represented by a movement from
Definitions:
Direct Payments
Cash transfers from government to individuals or businesses, often used to provide subsidies, welfare benefits, or to stimulate economic activity.
Countercyclical Payments
Government payments or subsidies, especially in agricultural policy, that increase when market prices are low and decrease when they are high, aiming to stabilize income.
Targeted Prices
Pricing strategies that aim specifically at certain segments of the market to maximize profitability and market share.
Import Quotas
Restrictions set by a country on the quantity of specific goods that can be imported within a given timeframe, aimed at protecting domestic industries.
Q79: You review a salesman's income over a
Q89: Last week,16 Mexican pesos could purchase one
Q113: The quantity theory of money predicts that,in
Q135: Open market operations refer to the purchase
Q153: The current low interest rates are seen
Q179: Refer to Table 7.5.Consider the statistics in
Q180: The Canadian government makes a profit from
Q199: A cash withdrawal from the banking system<br>A)decreases
Q219: A decrease in aggregate demand causes a
Q231: Refer to Figure 9.8.Given the economy is