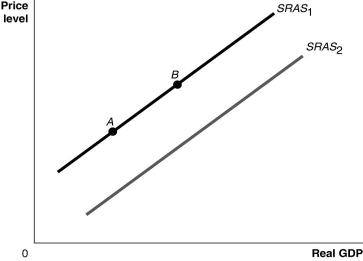
Figure 9.3  Alt text for Figure 9.3: In figure 9.3, a graph comparing real GDP and price level.
Long description for Figure 9.3: The x-axis is labelled, real GDP, with 0 at the vertex, and the y-axis is labelled, price level.2 lines are shown; SRAS1 and SRAS2.Line SRAS1 begins a little above the vertex and slopes up to the top right corner.Line SRAS2 follows the same slope as line SRAS1, but is plotted to the right.Points A and B are plotted on line SRAS1.Point A is near the left end of the line and point B is near the center of the line.
-Refer to Figure 9.3.Ceteris paribus, an increase in productivity would be represented by a movement from
Definitions:
Natural Monopoly
A condition in which a single firm can produce the entire output of a market at a lower cost than what it would be if there were multiple firms.
Socially Optimal Pricing
Pricing strategies aimed at maximizing societal welfare rather than corporate profits, emphasizing fairness and accessibility.
Marginal Cost
The cost of producing one additional unit of a product, important for decision-making in economics and business.
Fair-return Pricing
Pricing strategy aiming to set prices that are considered fair for consumers while allowing providers a reasonable profit.
Q9: If the Bank of Canada wants to
Q67: If the marginal propensity to save is
Q84: According to the quantity theory of money,if
Q87: Consumption spending is $5 million,planned investment spending
Q123: The five most important variables that determine
Q126: Which of the following is not a
Q127: Which of the following countries actually experienced
Q154: Potential GDP refers to the level of<br>A)real
Q225: How do lower income taxes affect aggregate
Q244: A stock market boom which causes stock