Figure 13.1 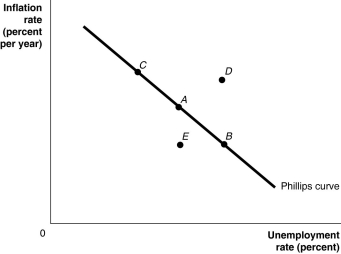 Alt text for Figure 13.1: In figure 13.1, a short-run Phillips curve.
Long description for Figure 13.1: The x-axis is labelled, unemployment rate percent, and the y-axis is labelled, inflation rate percent per year.A straight line labelled, Philips curve, begins at the top left corner and slopes down to the end of the x-axis.Point A is plotted half way along line Philips curve.Point B is plotted to the right of point A and point C is plotted is to the left of point A.Point D is plotted above this line, in the left center of the quadrant.Point E is plotted below this line, directly below point A.
-Refer to Figure 13.1. Suppose that the economy is currently at point A.If the Bank of Canada engaged in expansionary monetary policy, where would the economy end up in the short run?
Definitions:
Disclosure Note
Supplementary information provided in financial statements offering additional context or explanation about the figures presented, enhancing transparency.
Contingent Liability
A potential financial obligation that may arise in the future depending on the outcome of a specific event.
Reasonably Possible
A term used in accounting and law to indicate that a future event or condition has a chance of occurring.
Liability
A company's financial debt or obligations that arise during the course of its business operations.
Q27: If changes in inflation are higher than
Q27: The Bank of Canada adheres to the
Q61: Refer to Figure 13.2.Suppose the economy is
Q84: If there is currently a shortage of
Q121: If there is currently a surplus of
Q163: Suppose that the federal government allocates $5
Q170: Refer to Figure 13.11.A supply shock,such as
Q181: An increase in the level of structural
Q201: In an open economy,the government purchases multiplier
Q212: If actual inflation is greater than expected