Figure 13.3 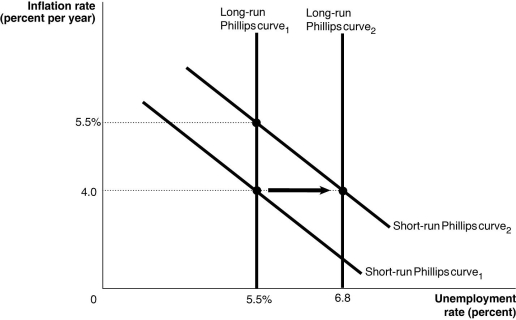 Alt text for Figure 13.3: In figure 13.3, a graph shows the shifts in the short-run and long-run Phillips curves.
Long description for Figure 13.3: The x-axis is labelled, unemployment rate percent.The y-axis is labelled, inflation rate (percent per year) .A straight line labelled, short-run Philips Curve 1, begins at the top left corner and slopes down to the end of the x-axis.A straight line labelled, short-run Philips Curve 2, follows the same slope as curve 1, but is plotted to the right.The area between curve 1 and short-run Philips curve 2 is indicated by a right pointing arrow.A straight line labelled, long-run Philips Curve 1 is perpendicular to the x-axis, begins from the x-axis value 5.5%.Long-run Philips Curve 1 intersects the short-run Philips Curve 1 at point (5.5%, 4.0) and intersects the Short-run Philips Curve 2 at point (5.5%, 5.5%) .A straight line labelled, long-run Philips Curve 2 is perpendicular to the x-axis, to right of the long-run curve 1, and begins from the x-axis value 6.8.Long-run Philips Curve 2 intersects the short-run Philips Curve 2 at point (6.8, 4.0) and the short-run Philips Curve 1 at a point on the bottom end of these lines, near the x-axis.The points of are connected to their respective coordinates on the x and y-axes with dotted lines.
-Refer to Figure 13.3.The shifts shown in the short-run and long-run Phillips curves between period 1 and period 2 could be explained by
Definitions:
Intraorganizational Negotiations
Negotiation processes that occur within an organization, typically involving internal stakeholders, departments, or groups.
Competitive Position
The standing or ranking of a company, product, or service in the marketplace compared to its competitors, based on factors like market share, strengths, and weaknesses.
Job Security
The confidence or probability that a person will maintain their employment without facing unemployment risks.
Securities Law
The area of law dealing with the regulation of securities (stocks, bonds, etc.), protecting investors, ensuring fair trading, and preventing fraud.
Q62: Refer to Figure 13.2.At which point are
Q85: Refer to Figure 12.3.In the graph above,suppose
Q126: Tax cuts on business income _ aggregate
Q142: An increase in federal government budget deficits
Q150: What impact might a decrease in the
Q157: Ceteris paribus,a real depreciation of the Canadian
Q171: Refer to Figure 12.5.In the dynamic model
Q201: The _ in Canada is best described
Q211: What is expansionary fiscal policy? What is
Q259: Fiscal policy actions that are intended to