Multiple Choice
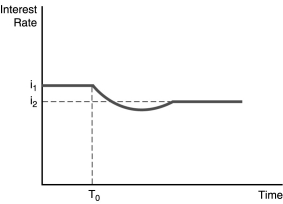
-The figure above illustrates the effect of an increased rate of money supply growth at time period T0.From the figure,one can conclude that the
Definitions:
Related Questions
Q19: Traders working for banks are subject to
Q27: Your bank has the following balance sheet<br><img
Q38: Economists have focused more attention on the
Q43: The initial money supply data reported by
Q58: A bank that wants to monitor the
Q59: If expectations are formed adaptively,then people<br>A)use more
Q60: If stock prices are expected to drop
Q61: If an individual moves money from a
Q66: American farmers who sell beef to Europe
Q80: Examples of discount bonds include<br>A)U.S.Treasury bills.<br>B)corporate bonds.<br>C)U.S.Treasury