Examlex

Solved

The Diagram Below Shows Two Production Possibilities Boundaries for Country

question 39

Multiple Choice

The diagram below shows two production possibilities boundaries for Country X. The diagram below shows two production possibilities boundaries for Country X.   FIGURE 1-4 -Refer to Figure 1-4.If Country X were producing at point C, A) the opportunity cost of moving to point B is to give up some consumption goods. B) the opportunity cost of moving to point A is zero. C) the opportunity cost of moving to point A is to give up some capital goods. D) this is the maximum output possible from given resources. E) it is not possible to move to any point on PPB<sub>1</sub> or PPB<sub>2</sub> without technological progress. FIGURE 1-4
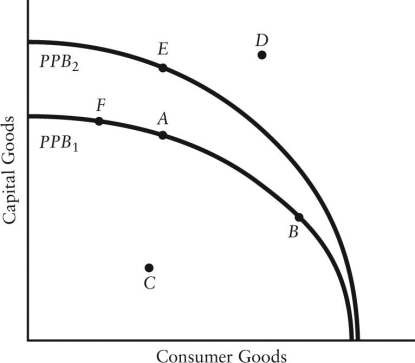
-Refer to Figure 1-4.If Country X were producing at point C,


Definitions:

Target Markets

A specific group of consumers at which a company aims its products and services.

Portfolio Analysis

Portfolio analysis is the process of evaluating and managing a collection of investments, assets, or business units to optimize performance and align with strategic goals.

Target Market

A specific group of potential consumers towards which a company directs its marketing efforts and strategies to sell its products or services.

Competitive Superiority

The advantage that a company has over its competitors, allowing it to generate greater sales or margins and/or retain more customers.

Related Questions