Multiple Choice
The diagram below shows selected cost and revenue curves for a firm in a monopolistically competitive industry. 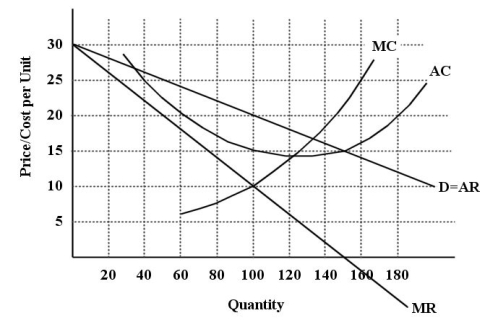 FIGURE 11-1
-Refer to Figure 11-1.If this firm is maximizing its profits,does the diagram depict a long-run equilibrium situation?
Definitions:
Related Questions
Q18: Refer to Figure 10-4.At what level of
Q26: Consider a monopolist that is able to
Q43: Refer to Figure 13-1.Suppose this firm initially
Q58: Refer to Figure 10-6.Suppose this pharmaceutical firm
Q61: One reason an oligopolistic firm may have
Q62: Suppose a piece of capital equipment will
Q66: Refer to Figure 8-2.Decreasing returns to scale
Q92: The present value of a given future
Q92: Refer to Figure 14-4.Suppose this labour market
Q109: Refer to Figure 14-6.The market begins in