Multiple Choice
The diagram below shows a market for tradable pollution permits. 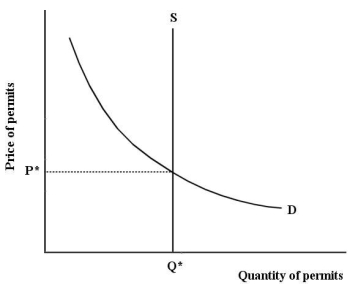 FIGURE 17-8
-Refer to Figure 17-8,which depicts the market for tradable pollution permits.The amount of permits Q* is determined by
Definitions:
Related Questions
Q3: Federal regulation aimed at reducing greenhouse-gas emissions
Q7: Refer to Table 20-4.When calculating GDP from
Q30: In a simple macro model with demand-determined
Q42: Refer to Figure 17-8,which depicts the market
Q53: What is the "marginal cost of pollution
Q58: Consider global greenhouse-gas emissions.Suppose that in 2016,greenhouse
Q60: Between 1995 and 2011,Canada's greenhouse gas emissions
Q73: Refer to Figure 18-3.Suppose that supply is
Q93: Zero pollution is almost surely NOT a
Q101: Consider the simplest macroeconomic model,with a closed