The diagram below shows desired aggregate expenditure for a hypothetical economy.Assume the following features of this economy:
∙ marginal propensity to consume (mpc) = 0.75
∙ net tax rate (t) = 0.20
∙ no foreign trade
∙ fixed price level
∙ all expenditure and income figures are in billions of dollars. 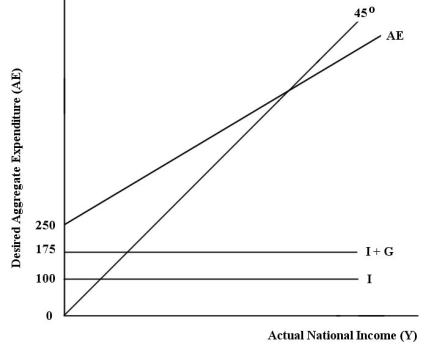 FIGURE 22-2
-Refer to Figure 22-2.What is the value of the multiplier in this economy?
Definitions:
Q18: Other things being equal,an exogenous increase in
Q20: If the economy's AS curve is upward
Q22: Which of the following is an equivalent
Q25: Refer to Table 26-1.What are the total
Q25: One of the reasons why the aggregate
Q44: If a family's annual disposable income rose
Q61: The group that tends to be most
Q71: With respect to long-run economic growth,one rationale
Q124: Refer to Table 26-1.What are the total
Q143: Refer to Figure 21-1.The marginal propensity to