The diagram below shows desired aggregate expenditure for a hypothetical economy.Assume the following features of this economy:
∙ marginal propensity to consume (mpc) = 0.75
∙ net tax rate (t) = 0.20
∙ no foreign trade
∙ fixed price level
∙ all expenditure and income figures are in billions of dollars. 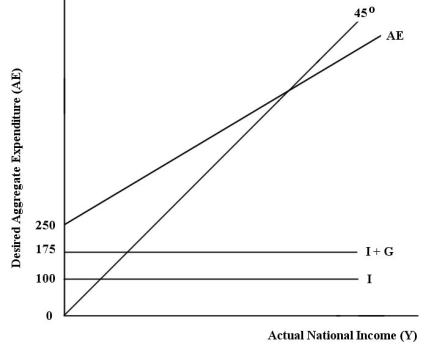 FIGURE 22-2
-Refer to Figure 22-2.What is the value of the multiplier in this economy?
Definitions:
Labour Standards
refers to the set of regulations and criteria that determine the minimum safe and healthy conditions for workers in the workplace.
Historical Experience
The knowledge and insights gained from past events and activities, which can inform future decisions and strategies.
Time Study
A method used to determine the time required for an employee to complete a given job.
Sample Size
Denotes the number of subjects or units chosen from a population for the purpose of statistical analysis.
Q7: If the economy is in macroeconomic equilibrium
Q16: A leftward shift in the aggregate demand
Q19: Short-run fluctuations in real GDP around its
Q46: A change in the Consumer Price Index
Q49: Consider the basic AD/AS model.Real GDP is
Q103: A rise in domestic prices relative to
Q116: Refer to Figure 22-3.What is the marginal
Q117: Consider the government's budget balance.Suppose G =
Q130: Consider the following news headline: "Information technology
Q143: Refer to Figure 21-1.The marginal propensity to