Multiple Choice
The figure shows a normal N(400, 23) distribution. Find the x value for the shaded area. 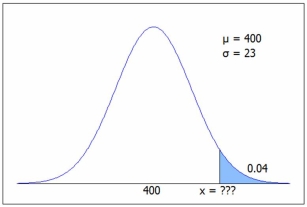 C.2 we get P(z > 1.75) = .0401, so x = µ + zσ = 400 + 1.75(23) = 440.3, or from Excel =NORM.INV(0.96,400,23) = 440.3.
Definitions:
Related Questions
Q14: In a contingency table, the probability of
Q15: In which situation may the sample proportion
Q44: A random variable X is best described
Q47: The figure shows a normal N(400, 23)
Q54: Concerning confidence intervals, which statement is most
Q68: Two well-known aviation training schools are being
Q70: Which statement is false?<br>A)If P(A) = .05,
Q75: If events A and B are dependent,
Q93: Which of the following is not a
Q105: A financial institution wishes to estimate the