Multiple Choice
In the figure given below,the curve TT shows how the allocation of a resource affects the well-being of two individuals,Hank and Monica. 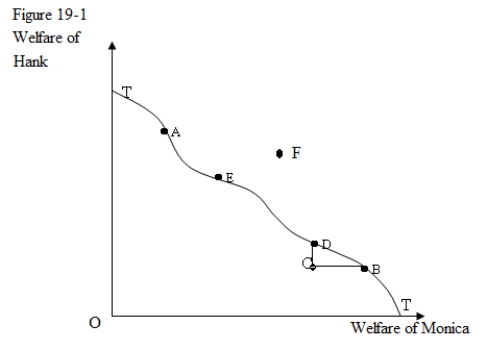
-Refer to Figure 19-1.Which of the following would represent a movement from an inefficient allocation of resources to an efficient allocation of resources?
Definitions:
Related Questions
Q6: In Figure 5-1,the total outlays on other
Q7: A firm's production cost equaling the opportunity
Q11: Consider an individual for whom consumption in
Q51: A consumer is willing to pay a
Q71: Some firms can attain lower production costs
Q71: (<br>A)Doug is 51 years old.He owns a
Q76: If the marginal rates of technical substitution
Q88: If there are no fixed costs and
Q89: In the absence of trade between a
Q94: In Figure 9-1,if the market price fell