The following figure shows the effect of a price ceiling in the market for yams.The market was initially in equilibrium at price P2 and quantity B.
Figure 10-1 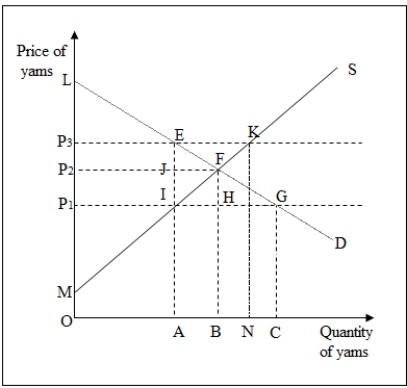
-In Figure 10-1,the aggregate producer surplus at the initial point of equilibrium,F,is area _____.
Definitions:
Focused Cost Leadership
A strategy that seeks the lowest costs of operations within a special market segment.
Strategy Management
The process of defining the strategy or direction of an organization, and making decisions on allocating resources to pursue this strategy.
Strategy Identification
The process of recognizing and defining the course of action or policies designed to achieve a major or overall goal.
Strategy Outsourcing
The practice of delegating specific strategic tasks or operations to external organizations, focusing on core competencies.
Q13: The slope of the long-run supply curve
Q21: The supply curve of a competitive firm
Q45: A firm that has monopoly power _.<br>A)can
Q46: Refer to Figure 11-4.What is the firm's
Q46: Refer to Table 14-4.Assume for this question
Q62: In the dominant firm model of oligopoly,the
Q67: Average fixed cost [AFC] is the:<br>A)horizontal distance
Q70: The marginal rate of technical substitution:<br>A)equals the
Q80: Refer to the payoff matrix in Table
Q89: In the absence of trade between a