The following figure shows the intersection of the demand and supply curves for a commodity in the domestic market at price P2 and quantity Q2,in the absence of trade.With trade,the supply curve shifts to Supplytrade.
Figure 10-4 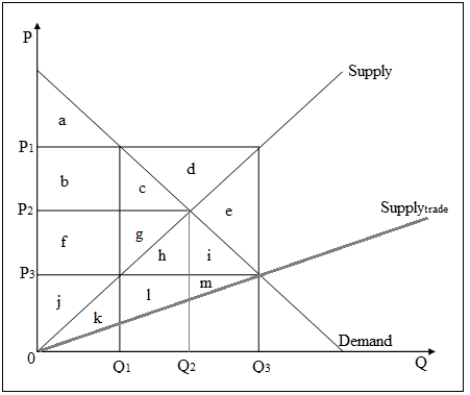
-Refer to Figure 10-4.The quantity of imports into the domestic market is given by _____.
Definitions:
Unfair Practices Act
Legislation intended to prevent deceptive, fraudulent, or unfair business practices.
Barriers to Entry
Obstacles that prevent new competitors from easily entering an industry or area of business.
Governmental Prohibitions
Regulations or laws imposed by a government to forbid specific activities, products, or services within its jurisdiction.
Strong-Armed Tactics
Aggressive or forceful strategies used to influence or control outcomes, often in a business or negotiation context.
Q8: An isoquant map,with labor on the horizontal
Q12: Which of the following is constant along
Q12: Define and illustrate iterated dominance and commitment
Q37: Refer to Figure 9-4.The total variable cost
Q51: A production isoquant identifies _.<br>A)the maximum output
Q75: A profit-maximizing monopoly firm that sells output
Q79: An isoquant shows _.<br>A)the different quantities of
Q79: Under peak-load pricing,the price in each period
Q87: Refer to Figure 12-1.If the monopolist practices
Q96: Zero economic profit occurs when:<br>A)price equals minimum