The following data reflect the number of customers who test drove new cars each day for a sample of 20 days at the Redfield Ford Dealership. 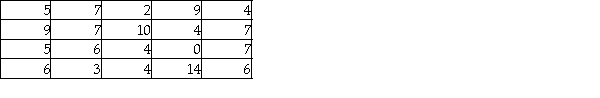 Given these data,what is the variance?
Definitions:
P Chart
A type of control chart used for monitoring the proportion of defective items in a sample over time in quality control processes.
Sample Proportion
The fraction or percentage of the sample that has a particular trait or characteristic of interest.
Control Limits
Statistical boundaries in process control that indicate the acceptable range of process variation.
Centerline
The midpoint value in a control chart that represents the average performance of the process being studied.
Q3: Why should a histogram contain no gaps
Q32: The managers of a local golf course
Q52: The size of the sampling error that
Q57: The Hawkins Company randomly samples 10 items
Q75: At gambling casinos all over the country,a
Q90: A tire manufacturing company is interested in
Q104: The Ski Patrol at Criner Mountain Ski
Q122: When using Excel's Histogram option under the
Q130: Roscoe and Associates makes computer software for
Q147: One of the reasons that managers prefer