The following graph (A) represents the cost curves for a representative firm in a perfectly competitive market.The market demand is shown in graph (B) :
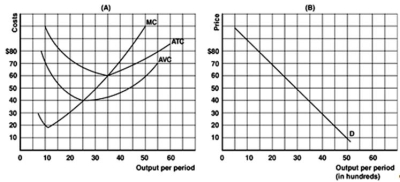
-Refer to the above graph above to answer this question.At the equilibrium price in this market,what will be the representative firm's output?
Definitions:
Do Your Best Goal
A motivational objective that encourages individuals to perform at their maximum capability without setting a specific performance target.
Expectancy Theory
A motivation theory suggesting that individuals are likely to act in a certain way based on the expectation that the act will be followed by a given outcome and the attractiveness of that outcome.
Instrumentality
The perceived relationship between performance and the attainment of desired outcomes, in the context of motivation theory.
Equity Theory
A concept in social psychology that suggests individuals determine the fairness of their job outcomes by comparing themselves to others.
Q4: What is productive efficiency?<br>A)Production of a combination
Q25: In which of the following market structures
Q25: The cumulative difference between what buyers are
Q39: All of the following statements,except one,are valid
Q62: Suppose a firm builds a larger plant
Q65: Refer to Figure 9.9 to answer the
Q69: Define product differentiation.
Q93: What is meant by the term natural
Q119: Refer to the above graph to answer
Q148: Refer to the graph above to answer