The following plot shows two titration curves,each representing the titration of 50.00 mL of 0.100 M acid with 0.100 M NaOH. 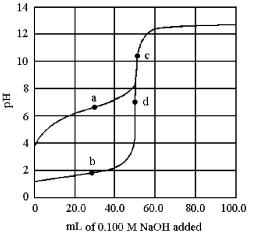
-At which point a-d is the pKa of the acid equal to the pH?
Definitions:
Sexually Explicit
Content or material that graphically demonstrates, describes, or pertains to sexual acts, organs, or themes.
Trademark Infringement
Employing a trademark or service mark without authorization in association with goods and/or services, with the potential to mislead, deceive, or create misunderstanding about the provider of the goods and/or services.
Meta Tag
A snippet of text in HTML code that describes the contents of a web page for search engine optimization purposes.
Ford Motor
An American multinational automaker known for producing cars, trucks, and automotive parts and services.
Q59: An electrolytic cell is<br>A)a battery.<br>B)a cell in
Q61: What is the reduction half-reaction for the
Q83: Arrange the three acids in order of
Q102: Calculate the pH of a 0.100 M
Q116: The chemical system shown below is at
Q116: Which of the following statements is false
Q147: Shown below is a concentration vs.time plot
Q169: Given that E°<sub>red</sub> = -0.26 V for
Q206: Arrange the following 0.10 M aqueous solutions
Q209: The shorthand notation for the galvanic cell