In a Monte Carlo study, econometricians generate multiple sample regression functions from a known population regression function. For example, the population regression function could be Yi = ?0 + ?1Xi = 100 - 0.5 Xi. The Xs could be generated randomly or, for simplicity, be nonrandom ("fixed over repeated samples"). If we had ten of these Xs, say, and generated twenty Ys, we would obviously always have all observations on a straight line, and the least squares formulae would always return values of 100 and 0.5 numerically. However, if we added an error term, where the errors would be drawn randomly from a normal distribution, say, then the OLS formulae would give us estimates that differed from the population regression function values. Assume you did just that and recorded the values for the slope and the intercept. Then you did the same experiment again (each one of these is called a "replication"). And so forth. After 1,000 replications, you plot the 1,000 intercepts and slopes, and list their summary statistics.
Here are the corresponding graphs: 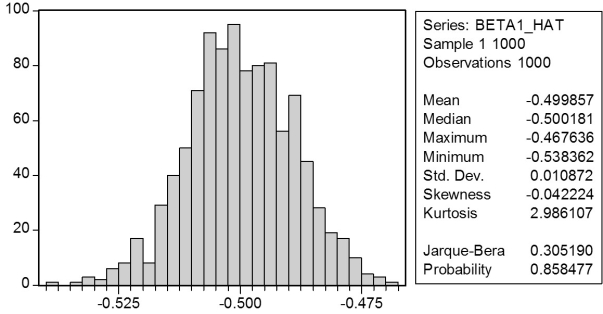
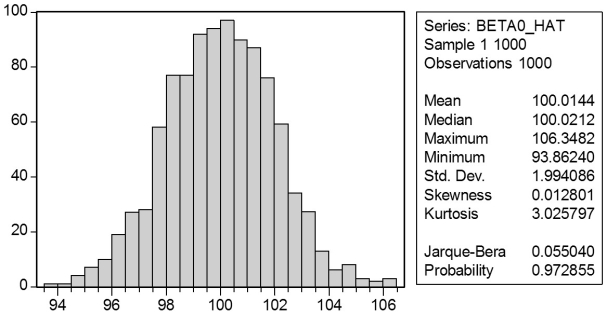 Using the means listed next to the graphs, you see that the averages are not exactly 100 and -0.5. However, they are "close." Test for the difference of these averages from the population values to be statistically significant.
Definitions:
Direct Labor
Labor costs that can be directly traced to the production of specific goods or services, such as wages for assembly line workers.
Predetermined Overhead Rate
A rate used to allocate manufacturing overhead to products or job orders, calculated before the period begins based on estimated costs and activity levels.
Manufacturing Overhead
All indirect manufacturing costs, including indirect labor, materials, and other expenses not directly tied to the production of goods.
Finished Goods
Finished goods refer to completed products that are ready for sale but have not yet been sold to customers.
Q5: In a two regressor regression model, if
Q11: Consider a competitive market where the demand
Q15: _ is the prediction of special relativity
Q22: Macroeconomists who study the determinants of
Q34: The OLS estimator is derived by<br>A)connecting the
Q35: The error term is homoskedastic if<br>A)var(u<sub>i</sub>
Q43: Give at least three examples from macroeconomics
Q58: The t-statistic is defined as follows:<br>A)
Q61: Imagine that you had discovered a
Q88: All quarks have 1/3 the electric charge