You have collected quarterly data on Canadian unemployment (UrateC)and inflation (InfC)from 1962 to 1999 with the aim to forecast Canadian inflation.
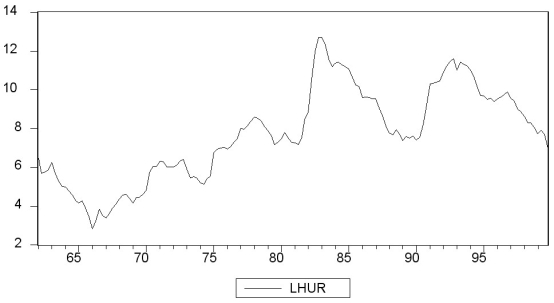
(a)To get a better feel for the data, you first inspect the plots for the series. 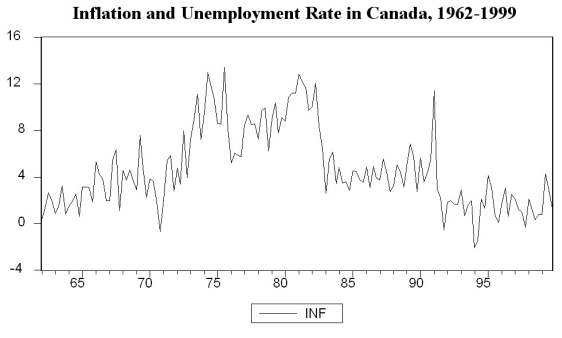
 Inspecting the Canadian inflation rate plot and having calculated the first autocorrelation to be 0.79 for the sample period, do you suspect that the Canadian inflation rate has a stochastic trend? What more formal methods do you have available to test for a unit root?
(b)You run the following regression, where the numbers in parenthesis are homoskedasticity-only standard errors:
Test for the presence of a stochastic trend. Should you have used heteroskedasticity-robust standard errors? Does the fact that you use quarterly data suggest including four lags in the above regression, or how should you determine the number of lags?
(c)To forecast the Canadian inflation rate for 2000:I, you estimate an AR(1), AR(4), and an ADL(4,1)model for the sample period 1962:I to 1999:IV. The results are as follows: 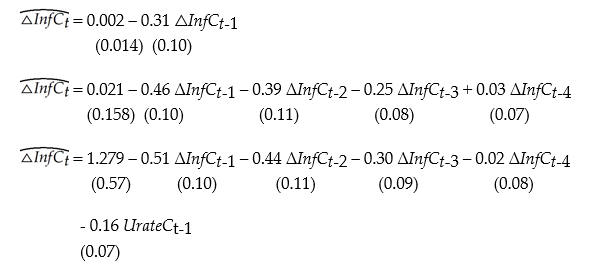
In addition, you have the following information on inflation in Canada during the four quarters of 1999 and the first quarter of 2000:
Inflation and Unemployment in Canada, First Quarter 1999 to First Quarter 2000 For each of the three models, calculate the predicted inflation rate for the period 2000:I and the forecast error.
(d)Perform a test on whether or not Canadian unemployment rates Granger-cause the Canadian inflation rate.
Definitions:
Cross-Docking
A logistics procedure where products received at a warehouse or distribution center are not stored but instead directly transferred from one truck to another, minimizing storage time and costs.
In-Process Inventory
Items or materials that are currently being worked on or processed in a manufacturing or production environment.
Cargo Containers
Large standardized shipping containers used to transport goods by sea, rail, or road.
Efficient Supply Chain
The optimization of processes in the supply chain to ensure the fastest, most cost-effective way of getting products from production to consumer.
Q8: The true causal effect might not be
Q8: Consider the multiple regression model with
Q11: To estimate dynamic causal effects, your textbook
Q14: The maximum likelihood estimation method produces, in
Q22: Write a short essay about the Overidentifying
Q28: (Requires Calculus)In the equation <span
Q42: For this question, use the California Testscore
Q48: When X<sub>t</sub> is strictly exogenous, the following
Q51: (Requires Calculus)In the multiple regression model you
Q123: If the reserve-deposit ratio is less than