There is some evidence that the Phillips curve has been unstable during the 1962 to 1999 period for the United States, and in particular during the 1990s. You set out to investigate whether or not this instability also occurred in other places. Canada is a particularly interesting case, due to its proximity to the United States and the fact that many features of its economy are similar to that of the U.S.
(a)Reading up on some of the comparative economic performance literature, you find that Canadian unemployment rates were roughly the same as U.S. unemployment rates from the 1920s to the early 1980s. The accompanying figure shows that a gap opened between the unemployment rates of the two countries in 1982, which has persisted to this date. 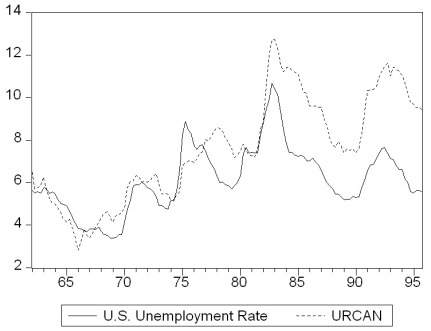 Inspection of the graph and data suggest that the break occurred during the second quarter of 1982. To investigate whether the Canadian Phillips curve shows a break at that point, you estimate an ADL(4,4)model for the sample period 1962:I-1999:IV and perform a Chow test. Specifically you postulate that the constant and coefficients of the unemployment rates changed at that point. The F-statistic is 1.96. Find the critical value from the F-table and test the null hypothesis that a break occurred at that time. Is there any reason why you should be skeptical about the result regarding the break and using the Chow-test to detect it?
(b)You consider alternative ways to test for a break in the relationship. The accompanying figure shows the F-statistics testing for a break in the ADL(4,4)equation at different dates. 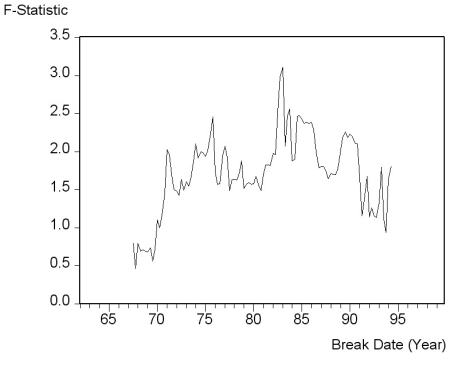 The QLR-statistic with 15% trimming is 3.11. Comment on the figure and test for the hypothesis of a break in the ADL(4,4)regression.
(c)To test for the stability of the Canadian Phillips curve in the 1990s, you decide to perform a pseudo out-of-sample forecasting. For the 24 quarters from 1994:I-1999:IV you use the ADL(4,4)model to calculate the forecasted change in the inflation rate, the resulting forecasted inflation rate, and the forecast error. The standard error of the ADL(4,4)for the estimation sample period 1962:1-1993:4 is 1.91 and the sample RMSFE is 1.70. The average forecast error for the 24 inflation rates is 0.003 and the sample standard deviation of the forecast errors is 0.82. Calculate the t-statistic and test the hypothesis that the mean out-of-sample forecast error is zero. Comment on the result and the accompanying figure of the actual and forecasted inflation rate. 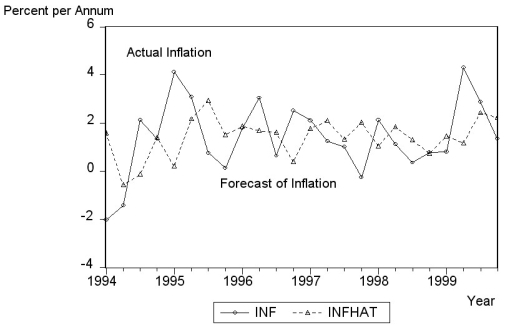
Definitions:
Narcotic
A class of substances that relieve pain and induce a state of sleep or stupor; often associated with opioids, which can be both legal medications and illicit drugs.
Barbiturates
A class of drugs that are used as sedatives and hypnotics, which can depress the central nervous system.
Drug Interaction
A modification in the effect of a drug when it is taken in combination with another drug, leading to increased efficacy, reduced effectiveness, or adverse side effects.
Overstimulation
A condition resulting from exposure to more sensory input, information, or activity than the brain can process comfortably, leading to stress or cognitive overload.
Q17: The following tools from multiple regression analysis
Q34: A nonlinear function<br>A)makes little sense, because variables
Q34: In Macroland,autonomous consumption equals 100,the marginal propensity
Q40: Describe the major differences between a randomized
Q45: Correlation of the regression error across observations<br>A)results
Q53: Consider the multiple regression model with
Q69: The money supply in Econland is 1,000,and
Q107: An increase in disposable income<br>A) increases consumption
Q152: The slope of the consumption function between
Q185: Based on the Keynesian cross diagram above,if