Table 9.3
Balance Sheet
General Talc Mines
December 31, 2003 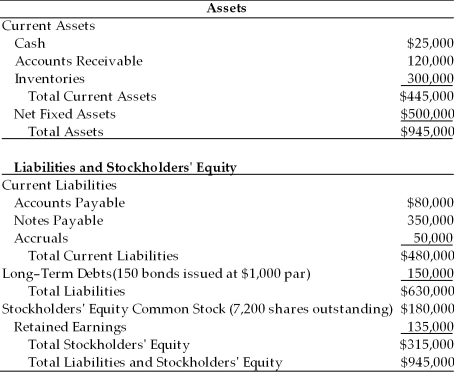
-A firm has determined its optimal capital structure, which is composed of the following sources and target market value proportions: 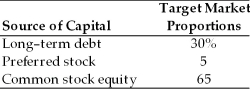 Debt: The firm can sell a 20-year, $1,000 par value, 9 percent bond for $980. A flotation cost of 2 percent of the face value would be required in addition to the discount of $20.
Preferred Stock: The firm has determined it can issue preferred stock at $65 per share par value. The stock will pay an $8.00 annual dividend. The cost of issuing and selling the stock is $3 per share.
Common Stock: The firm's common stock is currently selling for $40 per share. The dividend expected to be paid at the end of the coming year is $5.07. Its dividend payments have been growing at a constant rate for the last five years. Five years ago, the dividend was $3.45. It is expected that to sell, a new common stock issue must be underpriced at $1 per share and the firm must pay $1 per share in flotation costs. Additionally, the firm's marginal tax rate is 40 percent.
Calculate the firm's weighted average cost of capital assuming the firm has exhausted all retained earnings.
Definitions:
Noncash Investing
Investment activities that do not involve the immediate inflow or outflow of cash, such as acquiring assets through the issuance of equity.
Capital Acquisitions Ratio
A financial metric that compares total acquisitions of property, plant, and equipment with cash flow from operating activities, indicating the extent to which operating cash flows are used to finance capital expenditures.
Operating Activities
The principal revenue-producing activities of an entity and other activities that are not investing or financing activities.
Comparative Balance Sheets
Comparative balance sheets present the financial position of a business at different points in time, allowing for analysis of trends and changes.
Q10: A firm has issued 10 percent preferred
Q31: A mining company is offering to trade
Q32: Tangshan Antiques has a beta of 1.40,
Q67: Nico wants to invest all of his
Q76: The preemptive right gives the shareholder the
Q78: Interest paid to bondholders is tax deductible
Q102: Angel capitalists or angels are wealthy individual
Q105: A firm has an outstanding issue of
Q178: As randomly selected securities are combined to
Q215: A call feature in a bond allows