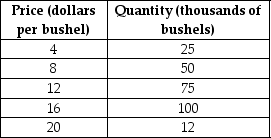
Use the following supply schedule for cherries to draw a graph of the supply curve. Be sure to label the supply curve and each axis, and show each point on the supply curve.
Definitions:
Agricultural Commodities
Basic goods used in commerce that are interchangeable with other goods of the same type, produced through farming activities.
Price Support Program
Governmental policies designed to maintain the price of a commodity at a certain level, to protect producers from market volatility.
Surplus
The amount by which the quantity supplied of a product exceeds the quantity demanded at a specific price.
Price Support Program
Government initiatives aimed at maintaining the market price of a commodity above its competitive equilibrium level.
Q5: Using a supply and demand graph, illustrate
Q8: Market equilibrium occurs where supply equals demand.
Q10: What factors would make you more sensitive
Q13: If the price of hairspray is represented
Q14: If a country is producing efficiently and
Q26: Refer to Figure 3-8. The graph in
Q92: Suppose the absolute value of the price
Q98: If the opportunity cost of producing more
Q106: Suppose a hurricane decreased the supply of
Q107: Voluntary exchange between buyers and sellers generates