Multiple Choice
Figure 5.1 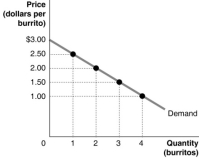 Figure 5.1 shows Arnold's demand curve for burritos.
-Refer to Figure 5.1.If the market price is $2.00, what is the consumer surplus on the second burrito?
Definitions:
Related Questions
Q44: Refer to Table 5-6. The equations above
Q47: Refer to Figure 5-1. If the market
Q57: If the Apple iPhone and the Samsung
Q83: The midpoint formula is used to measure
Q101: In the short run, marginal product of
Q119: A network externality causes firms to sacrifice
Q126: Suppose a decrease in the supply of
Q137: Which of the following is a factor
Q211: We can derive the market demand curve
Q226: All but one of the following have