Multiple Choice
Table 5.4 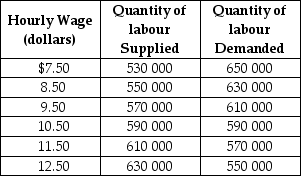 Table 5-4 shows the demand and supply schedules for labour market in the city of Pixley.
-Refer to Table 5.4.Suppose that the quantity of labour supplied increases by 40 000 at each wage level.What are the new free market equilibrium hourly wage and the new equilibrium quantity of labour?
Definitions:
Related Questions
Q30: Refer to Table 5-4. Suppose that the
Q44: A change in the price of a
Q48: Suppose that when the price per ream
Q60: Assume that you own a small boutique
Q65: Draw a demand curve and label it
Q113: Which of the following is an example
Q126: In January, buyers of gold expect that
Q157: Economic efficiency is a market outcome in
Q174: The marginal rate of substitution is determined
Q208: What is a Giffen good?