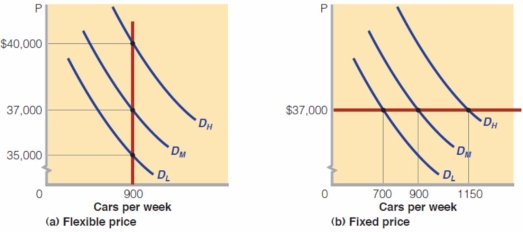
-The above diagram (a) represents the demand for and supply of a brand of automobile (Turbo-car) for a car manufacturing company named Fancy Auto.Assume that DL represents low demand for the Turbo-car,DM represents the medium level of demand and,DH represents the high level of demand for Turbo-car and Fancy Auto's optimal output level is 900 cars per week.If the prices are flexible,Fancy Auto:
Definitions:
Demand And Supply Shocks
Unexpected events that cause sudden and significant changes in the demand or supply of goods and services in the economy.
Marginal Revenue
The increase in income resulting from the sale of one extra unit of a product or service.
Average Revenue
The amount of revenue a company receives per unit of sales, calculated by dividing total revenue by the number of units sold.
Market Equilibrium
A condition in which market supply and demand balance each other, and as a result, prices become stable.
Q8: To facilitate the international comparisons of living
Q8: If the natural rate of unemployment is
Q19: Assuming inflexible prices,if the demand for many
Q19: During a serious recession we would expect
Q19: Public choice theorists point out that the
Q26: Setup Corporation buys $100,000 of sand,rock,and cement
Q72: Which of the following is an example
Q89: Refer to the information below.Which of the
Q95: The following table presents the demand schedule
Q173: Refer to the above.An increase in the