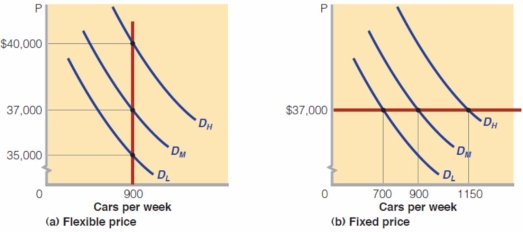
-The above diagram (a) represents the demand for and supply of a brand of automobile (Turbo-car) for a car manufacturing company named Fancy Auto.Assume that DL represents low demand for the Turbo-car,DM represents the medium level of demand and,DH represents the high level of demand for Turbo-car and Fancy Auto's optimal output level is 900 cars per week.If the prices are flexible,Fancy Auto:
Definitions:
Profit-maximizing Quantity
The point of production where a company reaches its maximum profit, occurring when marginal revenue is equal to marginal cost.
Profit-maximizing Price
The price at which a firm can achieve the highest possible profit.
Total Cost
Refers to the complete cost of production that includes both fixed and variable costs.
Total Revenue
The total amount of money a firm receives from the sale of its products or services, calculated by multiplying the price per unit by the number of units sold.
Q18: In 2008-2009,the Canadian economy experienced:<br>A) a depression.<br>B)
Q37: A market supply schedule for a product
Q43: The median-voter model implies that a political
Q77: Between 1945 - 2011,the labour force in
Q93: Chronic budget deficits can be attributed to:<br>A)
Q98: The most important contributor to increases in
Q105: The natural rate of unemployment in Canada
Q110: Durable goods are products with expected lives
Q164: If nominal GDP rises:<br>A) real GDP may
Q273: Which diagram above illustrates the effect on