Consider the expected returns (in percent) from two investment options. Beth wants to determine if investment 1 has a lower variance. Use the following summary statistics. 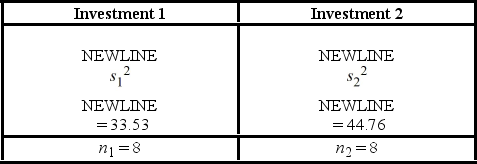 Which of the following are the competing hypotheses for this test?
Definitions:
Demand Curves
A graphical representation of the relationship between the price of a good and the quantity demanded by consumers, typically downward sloping, indicating that demand decreases as price increases.
Supply Curve
The Supply Curve is a graphical representation showing the relationship between the price of a good or service and the quantity of that good or service that a supplier is willing and able to supply.
Marginal Cost Curve
A graph that shows the cost of producing one more unit of a good or service at each level of production.
Average Variable Cost
The cost per unit of varying inputs in the production process, calculated by dividing total variable costs by the quantity of output produced.
Q24: The heights (in cm) for a random
Q29: According to a report in USA Today,
Q30: The supervisor of an automobile sales and
Q62: For the goodness-of-fit test for normality to
Q68: A market researcher is studying the spending
Q87: Two random samples are considered independent if
Q97: In the following table, likely voters' preferences
Q98: A consumer magazine wants to figure out
Q99: Which of the below is not true
Q114: A fund manager wants to know if