The following data show the demand for an airline ticket dependent on the price of this ticket. 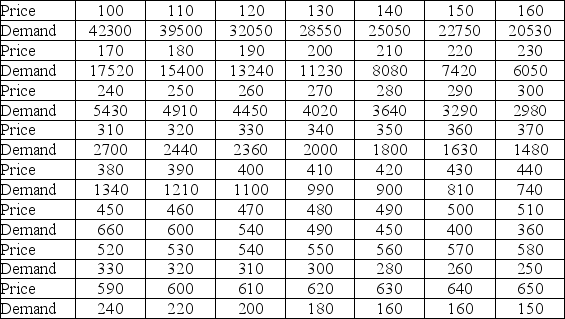 For the assumed cubic and log-log regression models, Demand = β0 + β1Price + β2Price2 + β3Price3 + ε and ln(Demand) = β0 + β1ln(Price) + ε, the following regression results are available.
  Assuming that the sample correlation coefficient between Demand and
  = exp(26.3660 - 3.2577 ln(Price) + (0.2071) 2/2) is 0.956, what is the percentage of variations in Demand explained by the log-log regression model?
Definitions:
Humanist
A person or scholar who focuses on the study of the humanities, emphasizing the value and agency of human beings.
Behaviorist
A psychologist or researcher who studies behavior through the lens of behaviorism, a theory of learning based on the idea that all behaviors are acquired through conditioning.
Psychodynamic
A psychological theory or approach that emphasizes the interplay of unconscious psychological processes in shaping feelings, thoughts, and behaviors.
Collectivist
Pertaining to cultures or societies that prioritize the group over individual interests, emphasizing community, cooperation, and interdependence.
Q7: The following table provides the price and
Q12: Over the past 30 years, the sample
Q20: A researcher wants to understand how an
Q46: Tukey's HSD 100(1 − α)% confidence interval
Q47: If the variance of the error term
Q52: Consider the sample regression equation <img src="https://d2lvgg3v3hfg70.cloudfront.net/TB6618/.jpg"
Q54: The following table shows the number of
Q57: An over-the-counter drug manufacturer wants to examine
Q68: Given the following portion of regression results,
Q93: A researcher wants to verify his belief