The following table shows the annual revenues (in millions of dollars) of a pharmaceutical company over the period 1990-2011. 
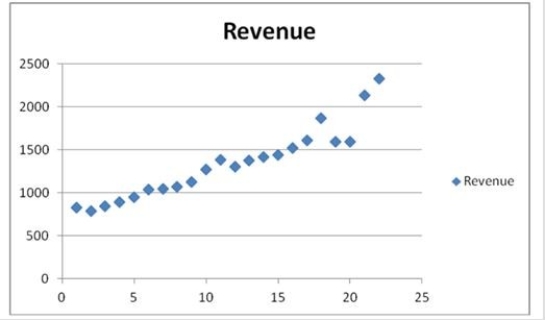 The scatterplot indicates that the annual revenues have an increasing trend. Linear, exponential, quadratic, and cubic models were fit to the data starting with t = 1, and the following output was generated.
  When all four trend regression equations are compared, which of them provides the best fit?
Definitions:
Perfectly Elastic
Describes a situation in which quantity demanded or supplied changes infinitely in response to any change in price, visualized as a horizontal line on a demand or supply graph.
Marginal Revenue Curve
A graphical representation showing how marginal revenue varies as the quantity of output produced changes.
Purely Competitive Firm
A business that operates in a market with infinite buyers and sellers, no barriers to entry, and a standard product, leaving the company as a price taker.
Unitary Elasticity
A situation in economics when a change in the price of a product leads to an equal proportionate change in the quantity demanded or supplied.
Q2: Emily Myers purchased a share of company
Q17: An exchange-traded option contract is:<br>A)a method by
Q59: A polynomial trend model that only allows
Q68: Consider the model y = β<sub>0 </sub>+
Q70: How many coefficients need to be estimated
Q81: The following data show the demand for
Q96: A simple linear regression, Sales = β<sub>0</sub>
Q100: A real estate analyst believes that the
Q101: The following table shows the annual revenues
Q112: Which of the following can be used