Multiple Choice
Consider the data that generate this plot covering time for months numbered 1 to 50. What characteristic is most prominent in the pattern? 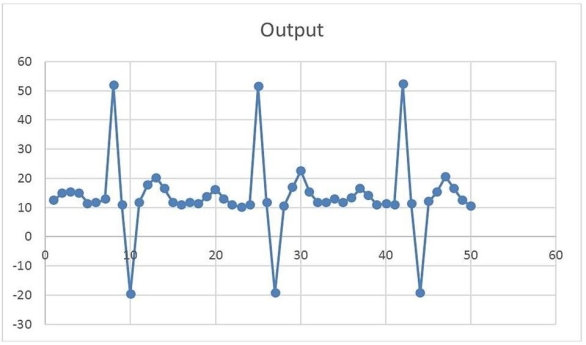
Definitions:
Related Questions
Q2: How can a sales and operations plan
Q4: _ is a process improvement philosophy that
Q6: Gerard is choosing between two methods of
Q12: The fill size for a small
Q19: The use of supply chain partners to
Q21: Forecasts are almost always wrong.
Q23: The value of goods on a "per
Q38: Consider the adjacent work stations in this
Q62: Green Belts have:<br>A)more Six Sigma training than
Q65: The earliest finish time of an activity