Instruction 12.21
A computer software developer would like to use the number of downloads (in thousands) for the trial version of his new shareware to predict the amount of revenue (in thousands of dollars) he can make on the full version of the new shareware. Following is the output from a simple linear regression along with the residual plot and normal probability plot obtained from a data set of 30 different sharewares that he has developed:
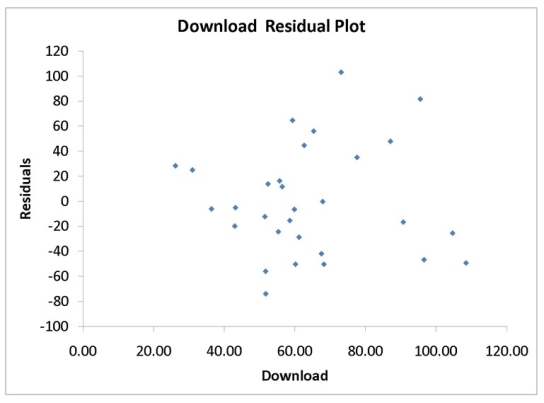
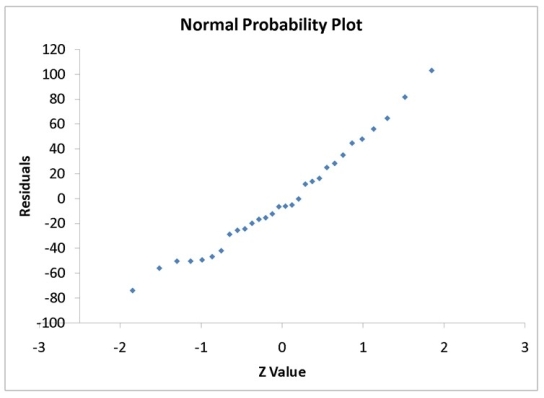
-Referring to Instruction 12.21,the normality of error assumption appears to have been violated.
Definitions:
Q12: Referring to Instruction 13.26,one economy in the
Q38: Referring to Instruction 12.25,the Durbin-Watson statistic is
Q62: Referring to Instruction 14-5,in testing the
Q69: Referring to Instruction 10-6,the critical values
Q71: In testing for the differences between the
Q82: The overall upward or downward pattern of
Q105: Referring to Instruction 12.28,the least squares estimate
Q108: When the sample sizes are equal,the pooled
Q153: Referring to Instruction 13.5,what are the predicted
Q187: Referring to Instruction 14-3,a centred three-year moving