Instruction 12.35
A computer software developer would like to use the number of downloads (in thousands) for the trial version of his new shareware to predict the amount of revenue (in thousands of dollars) he can make on the full version of the new shareware. Following is the output from a simple linear regression along with the residual plot and normal probability plot obtained from a data set of 30 different sharewares that he has developed:
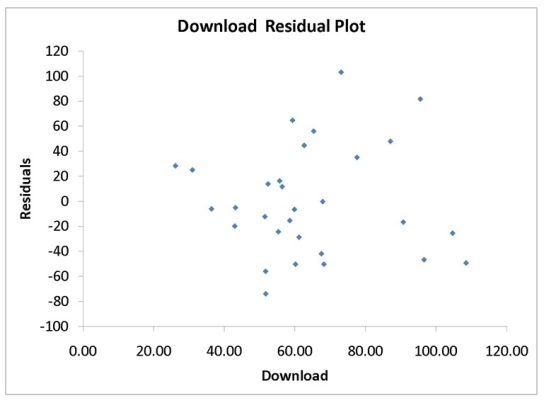
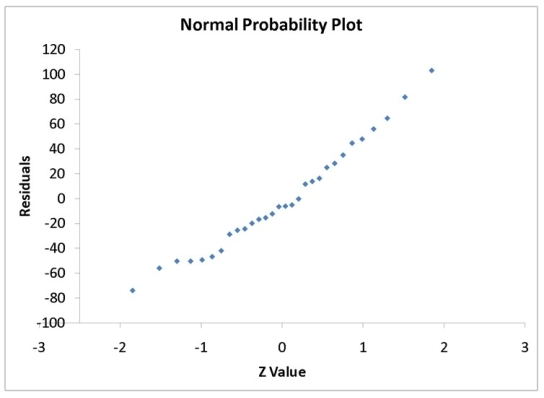
-Referring to Instruction 12.35,the null hypothesis for testing whether there is a linear relationship between revenue and number of downloads is 'There is no linear relationship between revenue and number of downloads'.
Definitions:
Additional Financing
Funds that are raised by a company through borrowing or issuing new equity, in addition to its existing capital.
Asset Turnover
A financial ratio that measures the efficiency of a company's use of its assets in generating sales revenue; the higher the turnover, the better.
Current Ratio
An indicator of a company's ability to meet short-term debt obligations; calculated by dividing current assets by current liabilities.
Fixed Assets
Fixed assets are long-term tangible assets that are used in the operations of a business and are not expected to be consumed or converted into cash within a year.
Q53: What is the value of the
Q64: The t test for the mean difference
Q71: The sample correlation coefficient between X and
Q81: Referring to Instruction 13.37 Model 1,which of
Q102: In a two-way ANOVA,it is easier to
Q116: Referring to Instruction 14-2,if a three-term moving
Q125: Referring to Instruction 12.34,the average weekly sales
Q149: Referring to Instruction 12.17,what is the standard
Q153: Referring to Instruction 12.3,the prediction for the
Q166: MAD is the summation of the residuals