Use the following figure to answer the question: Figure 5-2 :shows the quantity demanded of a good at various prices.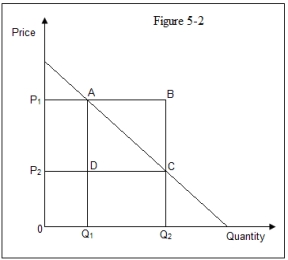
-Refer to Figure 5-2.The deadweight loss of an excise subsidy that lowers the price from P1 to P2 is area _____.
Definitions:
General Population
The total group of individuals from which any sample might be drawn, often referring to the entirety of a country's inhabitants.
Poverty Rate
A measure of the percentage of the population living below the poverty line, indicating the level of economic deprivation.
Discrimination Coefficient
A measure of the cost or disutility of prejudice; the monetary amount an employer is willing to pay to hire a preferred worker rather than a nonpreferred worker of the same ability.
Q9: On the graphs below,demonstrate the circumstances that
Q29: Suppose Microsoft stock will provide either a
Q34: A production function exhibits decreasing returns to
Q38: Explain how a change in price affects
Q39: Economic analysis suggests that if the marginal
Q40: For the cubic total cost function TC
Q58: Suppose that Luther's beta is 0.9.If the
Q68: The duration of the short run varies
Q72: The difference between an inferior good and
Q91: A firm employs 100 units of labor