Use the following figure to answer the question : Figure 13-1 : shows the Stackelberg model of a duopoly.Both firms face constant marginal costs equal to OJ and the market demand curve is AD.The Stackelberg firm produces an output of OF and OF is equal to FL. 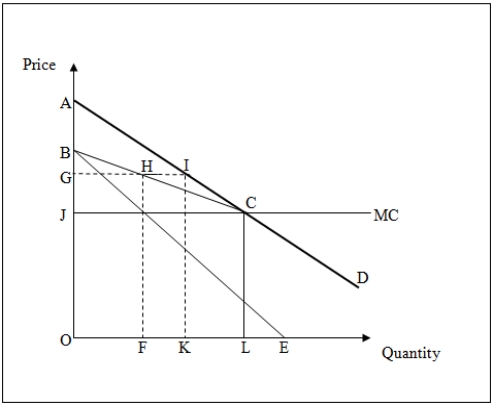
-Refer to Figure 13-1.In the Stackelberg equilibrium,the total industry output is _____.
Definitions:
High Performance Capability
The ability of an individual or organization to perform at an exceptionally high level, often exceeding standard expectations.
Intellectual
Relating to the ability to think and understand ideas and information at a complex level.
Creative
The quality or ability to create or invent something original and valuable.
Cross-sectional Studies
Research that analyzes data from a population, or a representative subset, at a specific point in time to examine relationships between variables.
Q8: Assume that Bosch is a company that
Q15: A compensating wage differential is the extra
Q27: Refer to Figure 9-4.The total variable cost
Q35: Which of the following best describes wage
Q76: Which of the following will lead to
Q83: What is peak-load pricing and why is
Q85: Refer to Figure 13-2.Which of the following
Q89: Which of the following depicts the change
Q91: A firm employs 100 units of labor
Q109: Refer to Figure 11-5.A fall in price