Use the information below to answer the following question(s) .
Marguerite Inc..expects to sell 20,000 pool cues for $20.00 each.Direct materials costs are $2.00,direct manufacturing labour is $12.00,and manufacturing overhead is $0.80 per pool cue.Each pool cue requires 0.5 kilograms (kg) of material which is all added at the start of production.The units in work-in-process beginning and ending inventory were half complete as to direct labour and manufacturing overhead costs;the units in beginning inventory are completed before new units are started..Each pool cue requires one hour of direct labour,and manufacturing overhead is allocated based on direct labour hours.The following inventory levels are expected to apply to 2016:
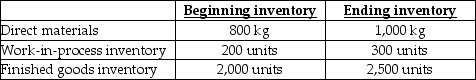
-What are the 2016 budgeted costs for direct manufacturing labour?
Definitions:
Slope
The measure of the steepness or incline of a line, typically described as the ratio of the vertical change to the horizontal change between two points on the line.
Positive Linear Relationship
A direct correlation between two variables in which they both increase or decrease together at a constant rate, as depicted by a positively sloped line on a graph.
Scatter Diagram
A graphical representation of the relationship between two quantitative variables, showing how one variable is affected by changes in the other variable.
Least Squares Method
A statistical technique used to determine the best-fitting line that minimizes the sum of the squared differences between observed and estimated values.
Q59: Sam's Furniture uses variance analysis to evaluate
Q66: The break-even point in tickets sold of
Q68: A rolling budget encourages management to be
Q69: Fresco Bottling Works manufactures glass bottles.January began
Q89: List four ways that activity-based management can
Q93: The following information pertains to ABC Corporation:<br><img
Q95: When using activity-based costing in a manufacturing
Q111: What is the budgeted direct cost rate
Q119: What is the budgeted indirect cost allocation
Q124: How is a budgeted fixed overhead cost