Figure 3-8 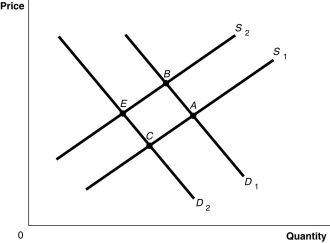
-Refer to Figure 3-8.The graph in this figure illustrates an initial competitive equilibrium in the market for motorcycles at the intersection of D1 and S2 (point B) .If there is an increase in number of companies producing motorcycles and a decrease in income (assume motorcycles are a normal good) ,the equilibrium could move to which point?
Definitions:
Two-tail Test
A statistical test in which the critical area of a distribution is two-sided and tests whether a sample is either greater than or less than a range of values.
Nominal Data
Data that represents categories with labels or names, where the order of the categories is not meaningful.
Z-test
A statistical test used to determine whether two population means are different when the variances are known and the sample size is large.
Chi-square Test
A statistical test used to determine if there is a significant difference between the observed frequencies and the expected frequencies in one or more categories.
Q8: Last month,the Tecumseh Corporation supplied 400 units
Q16: Refer to Table 2-12.This table shows the
Q52: Refer to Table 2-5.Does either Estonia or
Q59: Refer to Table 2-8.Which of the following
Q80: A consumer is willing to purchase a
Q156: Refer to Figure 19-5.Suppose the pegged exchange
Q177: An increase in quantity supplied is represented
Q186: What causes a production possibilities frontier to
Q204: Foreign purchases of stocks and bonds issued
Q230: In 18th century Europe,governments gave guilds legal