The table given below shows the total fixed and variable costs of a firm.Table 8.3
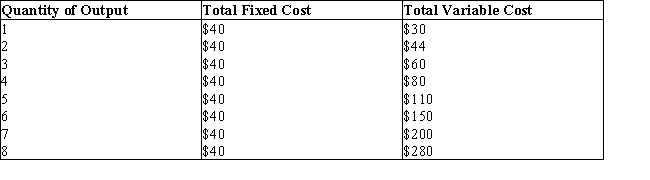
-Refer to Table 8.3. At what level of output does the average total cost starts increasing?
Definitions:
Supply Curve
A graphical representation showing the relationship between the price of a good and the quantity of the good that suppliers are willing to sell.
Demand Curve
A graph showing the relationship between the price of a good and the quantity demanded by consumers.
Market Price
The current price at which an asset or service can be bought or sold in a competitive marketplace.
Consumer Surplus
The difference between the total amount consumers are willing and able to pay for a good or service versus the total amount they actually pay.
Q13: The equimarginal principle illustrates:<br>A)that consumers are essentially
Q13: The permanent shut down point of a
Q18: If a consumer is buying three goods
Q22: Monopolization is a process by which the
Q24: Graphically, a firm's profit per unit of
Q52: The production possibilities curve of a low
Q65: The marginal cost curve intersects the average
Q97: Refer to Figure 10.4. The firm faces
Q107: Since an expensive sports car constitutes a
Q108: In Figure 11.4, the demand curve D<sub>2</sub>:<br>A)has