The figure given below shows the demand curves of two classes of buyers, for tickets to a football match.Figure 11.4
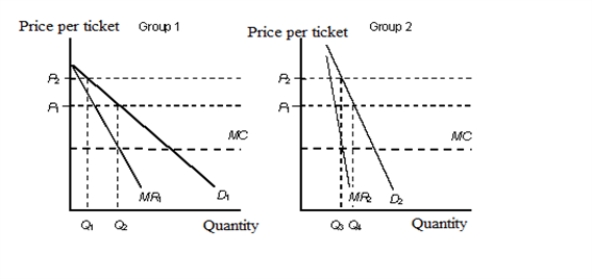 D1: Demand curve of group 1
D2: Demand curve of group 2
MR1: Marginal revenue of group 1
MR2: Marginal revenue of group 2
MC: Marginal cost
-In Figure 11.4, the demand curve D2:
Definitions:
Distribution Extremes
The varying strategies in distributing products, ranging from intensive distribution, where products are available everywhere, to exclusive distribution, where products are available only in select outlets.
Geographical Area
A defined physical region or space characterized by certain geographical features or boundaries.
Financial Service
Economic services provided by the finance industry, which encompasses a broad range of businesses that manage money.
Novice Investor
An individual who is new to investing, lacking in experience and knowledge in making investment decisions.
Q9: Economic freedom refers to the freedom of
Q14: At an output level above the profit-maximizing
Q16: If an average cost curve is U-shaped,
Q29: The characteristic that distinguishes a monopolistically competitive
Q54: Under an oligopoly market structure, rival firms
Q55: Which of the following is a measure
Q55: Strategic behavior occurs when a firm takes
Q66: If social regulation increases a firm's fixed
Q75: Overhead costs are identical to fixed costs.
Q95: Why does a monopolist face the market