The following graph shows the demand and cost curves of an imperfectly competitive firm. MC and ATC represent the marginal cost curve and the average cost curve respectively.Figure 9.1
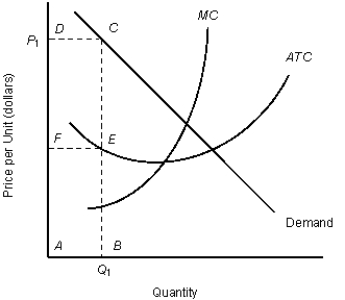
-Refer to Figure 9.1. At price P1, the firm sells quantity Q1, and total revenue is shown by:
Definitions:
Excess Supply
Occurs when the quantity of a good or service offered by producers exceeds the quantity demanded by consumers at the current price.
Excess Supply
A situation where the quantity of a good or service offered for sale by producers exceeds the quantity demanded by consumers at the current price.
Quantity Supplied
The amount of a product that producers are willing and able to sell at a given price over a specified period of time.
Quantity Demanded
The amount of a product that consumers are willing and able to purchase at a given price at a specific time.
Q8: The _ effect indicates that an individual's
Q29: According to Figure 13.1, the outcome of
Q42: Which of the following is a possible
Q58: Marginal utility diminishes more quickly:<br>A)the less durable
Q96: For a monopolist with a linear demand
Q97: According to Table 8.3, the firm's marginal
Q100: Higher the economic freedom in a country,
Q104: Refer to Figure 12.3. A perfectly competitive
Q113: When the marginal utility derived from a
Q135: Consumers should allocate their income so that